31 Surprising Coffee Statistics in 2024
Being a numbers (and coffee person), I love reading over coffee statistics.
The big numbers really frame how much coffee means to people from around the world.
If you’re also curious about the impact coffee to our day-to-day lives, then I think you’ll love this list of 30+ statistical findings on coffee – from people’s drinking habits to its production by the numbers.
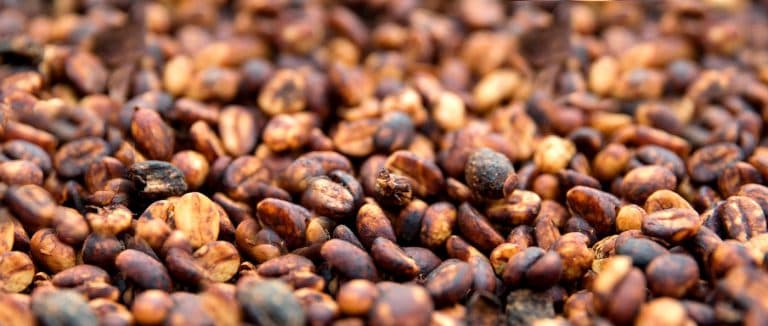
1. Far-Reaching Production: In 2023, there were 168.2 million 60kg bags of coffee produced around the world.
In 2023, a whopping 168.2 million bags, each weighing 60 kilograms, were produced globally (Source: ICO).
That’s basically unchanged from the previous year, which masks the large local changes from the expanding Americas, to the shrinking everywhere else. When looking at the numbers from the last five years, this production rate is quite stable for the coffee market.
2. Beans by the Billions: About 10.6 billion kilos of coffee are consumed in a year around the world.
Looking at 2023 data, around 177 million 60-kilogram bags of coffee were consumed around the globe (Source: ICO), which equals a staggering 10.6 billion kgs.
To put it into perspective, this is about the same as filling up about 7,200 Olympic-sized pools (the density of coffee beans is approximately 0.56 kg/l= 560 kg/m³, and such a pool has a volume of 2,500 m3).
3. Cups in a Kilo: Up to 140 cups of coffee can be produced from 1 kg of coffee beans.
A single kilogram of coffee beans can produce up to 140 cups of coffee if we consider single doses with 7 grams of coffee in each cup (the standard for an Italian espresso). Specialty coffee uses slightly more coffee per dose, about 9 g.
Just imagine: if 10 billion kilograms were consumed in 2021, that’s about 1.4 trillion cups of coffee if fixed at 7 grams per cup.
4. Caffeinate the Crowd: 62% of adult Americans drink coffee every day.
Around 62% of Americans over 18 years of age drink coffee every day (Source: ncausa.org). That’s 150 million American coffee drinkers who like adding a jolt of Java to their everyday routines.
Trends also showed that Americans under 40 increased coffee consumption by 40% since 2015, establishing a growing love for this caffeinated drink.

5. Third Time’s the Charm: An average of 3 cups per day are consumed by coffee drinkers in the US.
How much coffee do you drink in a day? The National Coffee Association’s Atlas of American Coffee reveals that Americans drink an average of 3 cups.
If you further crunch the numbers, that would account for 450 million cups of coffee per day. It’s also worth noting that the average cup size for coffee in the US is 9 ounces.
6. Sip Something Special: 30 million American adults drink specialty coffee drinks.
Among the 150 million daily coffee drinkers in the US, 30 million enjoy their dose of specialty coffee beverages on a daily basis (Source: e-importz.com).
These delectable drinks include mocha, latte, espresso, cappuccino, and more.
7. Specialty Coffee Sells: The sales of specialty coffee increase by 20% per year.
According to the same report, the trend of consuming specialty coffee continues to rise annually, getting a 20% increase per year. This accounts for 8% of the 18 billion dollar US coffee market.
The booming demand highlights a growing appreciation for high-quality, unique coffee flavors and indicates a shift in consumer preferences towards premium products, where consumers are willing to splurge on a superior coffee experience.
8. Casual Cups of Joe: 30% of the population are occasional coffee drinkers.
Not everyone is built for coffee on the daily. Statistics from E-Imports show that 30% of the US population drinks their coffee occasionally.
The statistic underlines the flexibility of coffee consumption habits, where it is not just a daily ritual for many, but also a casual indulgence enjoyed intermittently.
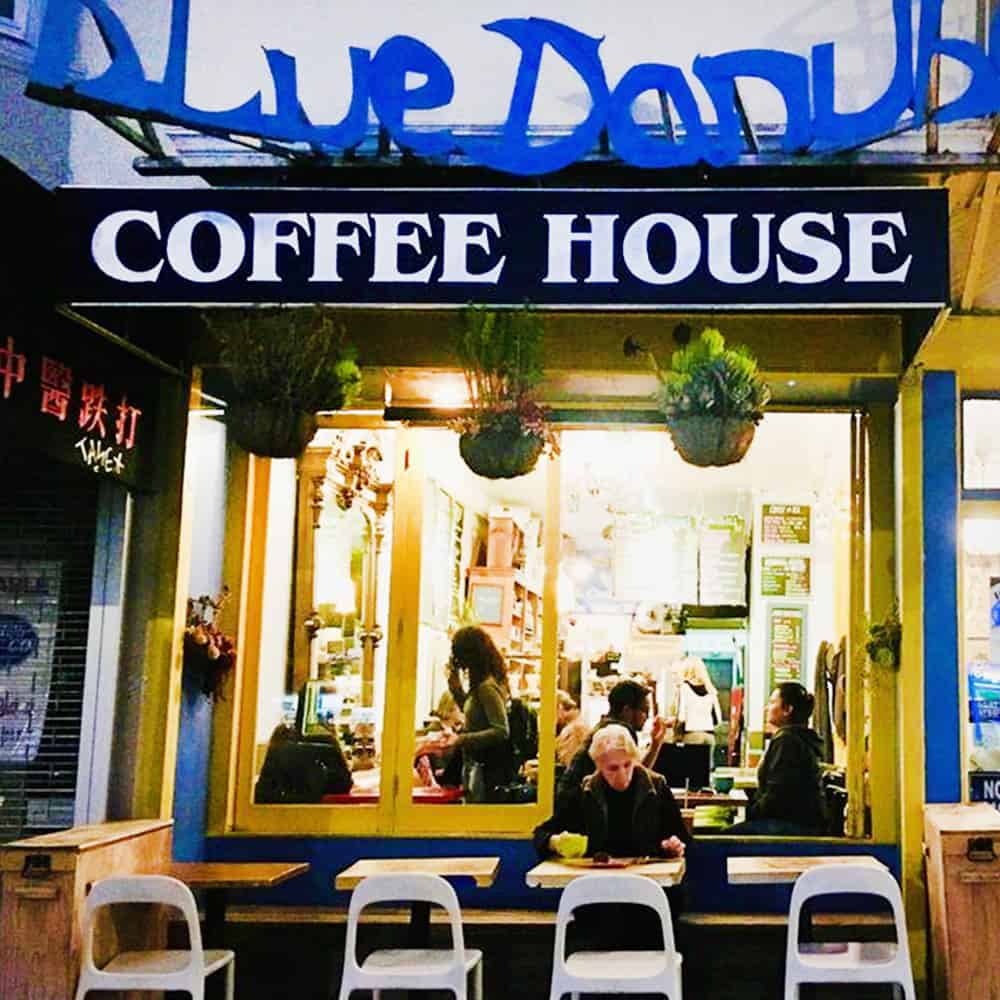
9. Cafe Conquest: Approximately 38,400 coffee shops operate in the US.
There are about 38,400 coffee shops in the US, and the numbers will only keep growing from there (Source: statista.com/statistics/1000058). The figures suggest that there will be more than 50,000 coffee shops in the years to follow.
This bustling growth paints a promising future for coffee enthusiasts and entrepreneurs alike, envisioning a vibrant and diverse coffee culture across the country.
10. Store-Studded Cities: Boston has the most coffee stores in the US per 100,000 residents.
Wondering which city has the most coffee shops to offer enthusiasts? Boston leads the list of cities with 61 coffee stores per 100,000 residents, followed by Washington, DC with 58 coffee shops per capita (Source: overheardonconferencecalls.com/business/cities-most-and-least-coffee-shops/).
Surprisingly, Seattle which is known as the home of Starbucks only ranked third with 56 coffee shops per one hundred-thousand residents.
11. Small Brands, Big Bucks: Independent coffee shops equal $12 billion in annual sales of coffee.
E-Imports data also showed that independent coffee shops contribute $12 billion in total to the annual sales of coffee. From these numbers, 31% are espresso-based drinks and the rest is brewed coffee.
For me, this is a clear indicator that people don’t always rely on the big companies for their caffeine fix, but they also support independent businesses.
12. Coffee On The Way: 200 to 300 cups of espresso and coffee-based drinks are sold in a day by an average espresso drive-thru.
If you’re in a rush and can’t make your own cup of coffee, it’s only natural to take a short pit stop at an espresso drive-thru so they can fix you your caffeinated fuel.
In a day, 200 to 300 cups of coffee drinks are being sold by an average espresso drive-thru business in the US. It’s quite interesting to glimpse how much coffee is consumed on the go every day.
13. Dollars for a Drink: $2.38 is the average price for brewed coffee in the US.
The average price for your daily kick of caffeine is $2.38 per cup of brewed coffee and $3.45 for espresso-based coffee drinks (Source: cardconnect.com).
Yes, the $5 caramel frappuccino you had at Starbucks definitely skews this datapoint upwards.
14. Strong vs. Sweet: 35% of coffee drinkers prefer black coffee while the rest drink coffee with sugar and cream.
About a third of the US population, specifically 35%, prefer their coffee to be pure black. Meanwhile, the rest of the populace likes to tame their drink’s strength with some sugar and/or cream.
I wonder what this would be for Starbucks patrons? 😀

15. Favored Flavors: The most common coffee additive is milk at 29%.
For coffee drinkers, the most popular add-on to their beverages is milk or dairy alternatives at 29% (Source: nationalcoffee.blog). For me, this doesn’t come as a surprise for me since we love our specialty coffee.
As for sugar, 27% like to add this to their cup of joe, giving them 48 to 96 calories if they add a teaspoon or two to their 3 cups of coffee for the day.
16. Java by Gender: Men and women drink as much coffee as each other.
Coffee is all-encompassing when it comes to gender. Women drink as much coffee as men, but statistics indicate that women are more concerned about the price than men.
The numbers also show that women drink coffee as a way to relax while men drink it to get the job done.
17. Billions Worth of Imports: About $7 billion worth of coffee is imported by the US.
Is the US a big spender when it comes to coffee? Absolutely. In 2021 alone, the US imported $6.92 billion worth of coffee (Source: statista.com).
Comparing the countries they pull their coffee from, Colombia takes the lead spot, consuming $1.47 billion worth of coffee that same year.
18. Home Brews Rule: 83% of Americans make their coffee at home.
As it turns out, the majority of the American population, specifically 83% of past-day coffee drinkers, had their coffee at home in 2023 (Source: ncausa.org).
You then have 35% of past-day coffee drinkers who had their caffeine fix away from home, which is up by 4% compared to data from 2021 but is still 6% lower than the 41% in 2020.
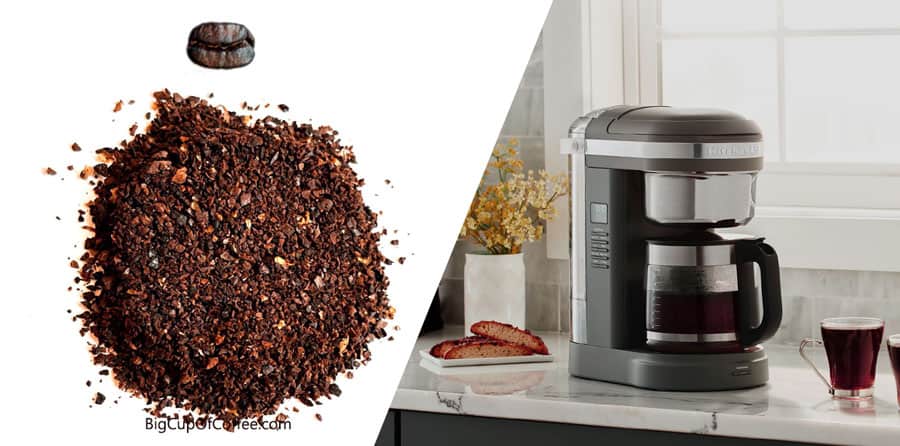
19. Drip Domination: 41% of coffee drinkers use a drip coffee maker.
According to NCA USA’s 2022 data, 41% of coffee drinkers who brew on their own use a trusty drip coffee maker. Personally, using a drip machine is not exactly my favorite method, but I acknowledge its convenience combined with affordability.
Drinkers of drip machine coffee are then followed by 27% single-cup system users, 9% cold brew enthusiasts, and 8% home baristas equipped with an espresso machine.
20. Coffee on the Cart: 35% of Americans who make their own coffee purchase it from grocery stores.
Where do you buy your coffee beans? According to the same source, the majority of people who brew their favorite cup of joe at home get their coffee from the grocery store.
Coffee statistics show that 35% of these coffee lovers purchase from the grocery, 26% from mass merchandisers, 13% from club stores, and another 13% order online.
21. Fair for the Farmers: 56% of Americans say that they’re more likely to buy coffee with the claim “fair price paid to the farmer”.
Looking at certain motivators for purchasing coffee, over half of the American population (56%) say that are more like to buy coffee which claims that a fair price is paid to the farmer, the National Coffee Association 2022 trends report revealed.
In case you’re wondering how your choice of coffee beans can affect the fairness of the farmers’ wages, have a look at these statistics on Fair Trade coffee.
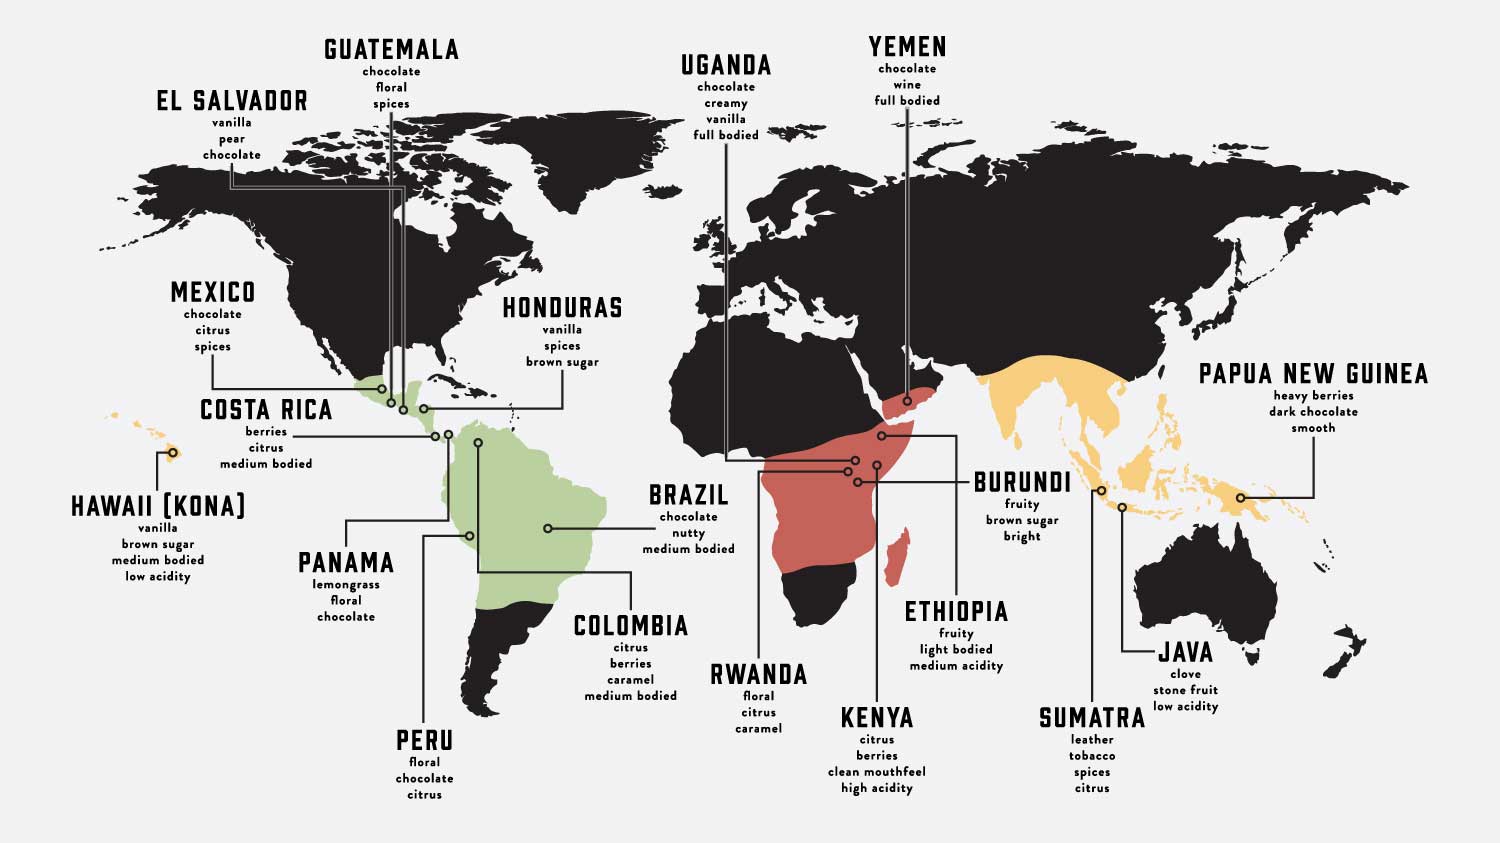
22. Brazil Brims with Brews: An average of 2.68 million metric tons of coffee is produced by its biggest producer, Brazil.
Brazil has held its place as the top coffee producing country for over 150 years now. Today, the South American country produces an average of 2.68 million metric tons of coffee every year (Source: nescafe.com/gb/understanding-coffee/coffee-producing-countries/).
Following Brazil is Vietnam which exports 1.5 million metric tons of coffee and Colombia’s 760,000 metric tons every year.
23. US is Huge in Consumption: 27,310 thousand 60kg bags of coffee are consumed by the US in a year, making it the world’s biggest consumer.
The United States takes the lead in global coffee consumption, consuming a staggering 27,310 thousand (27.3 million) 60kg bags of coffee beans in 2019 alone (Source: ico.org). This isn’t surprising at all, knowing that the US is home to the largest coffee chain company in the world, Starbucks.
After the US, the next big drinkers in the world are Brazil with 22 million 60kg consumed, and Germany with 8.67 million bags.
24. Luxembourgers Love Coffee: Luxembourg is the biggest consumer per capita using up 21.68 kg of coffee per person a year.
With a population of 634 million people consuming 21.68 kg of coffee per year, Luxembourg has the biggest coffee consumption per capita. In 2019, the country drank 13.76 million 60kg bags of coffee in total. There is a caveat though that you can read more about in our article on the countries with the largest coffee consumption.
Following Luxembourg in per capita consumption is Finland with 14.65 kilograms per capita and next is Sweden with 10.33 kilograms.
25. Coffee Beats Water: 66% of Americans say their favorite beverage is coffee.
Coffee tops the list of favorite drinks in the US. Over half of Americans drink more coffee than other beverages (Source: foodbeverageinsider.com). Surprisingly, coffee even beats water.
According to the ranking, 66% opted for coffee, 60% picked bottled water, and 47% chose tea. These three are followed by soft drinks at 42% and juice at 21%.
26. Cold Brew Craze: The market for cold brew jumps from $321 million to over a billion in just 5 years.
Coffee enthusiasts know how cold brew has really become very popular in recent years, but the figures can still be surprising for this uniquely brewed coffee.
In 2017, the promising cold brew market was valued at $321 million globally. In 2022, the market went up to $1.2 billion and it’s expected to reach $4.2 billion in 2028 (Source: researchgate.net).

27. Starbucks Stronghold: The leading coffee company Starbucks has a revenue of $26.58 billion.
It’s no secret that Starbucks leads the coffee company race, but as you enjoy your Frappuccino, have you wondered how much they really earn?
Starbucks has a net revenue of $26.58 billion in 2022 (Source: statista.com), and that comes from their stores that have amounted to over 35,000 around the globe.
28. Coffee Chain Kings: Starbucks, Dunkin’, and Dutch Bros. are the biggest coffee sellers in the US.
So Starbucks has the crown (literally on their logo) for the biggest coffee chain company with $24.56 billion worth of sales in 2021 (Source: statista.com/statistics/919774/), but which chains are closest to competing with them?
Dunkin’s comes second in the ranking with $10.41 billion worth of sales and Dutch Bros. Coffee with its $914 million sales.
29. Going Gourmet: Nearly 60% of coffee served in the US is brewed with premium beans.
Looking at 2020 data from the NCA USA, around 60% of the coffee sipped across America falls under the “gourmet” label, thanks to having been brewed with premium coffee beans.
What this means is that more than half of the population have high standards and choose high-quality coffee. Prices may be higher, but the flavor and the drinking experience are worth it.
30. Coffee Time: 65% of all coffee is consumed while drinkers are enjoying their breakfast.
It’s also interesting to note when exactly people like to drink their coffee. The numbers show that 74% of coffee is consumed during breakfast (Source: mdpi.com).
In the US, nine out of ten coffee drinkers over 24 years old consume a cup at breakfast while you people tend to consume coffee at lunchtime according to the Atlas of American Coffee.
31. More Pods? The Demand for Coffee Capsules is Growing Faster Than for Whole Beans.
According to industry research groups, the coffee capsule market grew at a rate of 7.9% from 2022 to 2023.
Considering the major environmental impact of coffee capsules, you are right to be disturbed.
Conclusion
From my perspective, the numbers don’t lie. The large digits showcasing how much coffee we both produce and consume annually highlight that this beverage is more than simple sustenance.
It’s indeed its own unique culture.
So the next you sip coffee, be sure to appreciate how it impacts the world, and perhaps use your newfound knowledge as a conversation starter at your local café.
And make sure you check out this post on 35 fun coffee facts, each is a great conversation starter 😉


I’m curious about the data source for the Coffee on the Cartstatistic. Is it based on a survey or retail sales analysis? Would love to dive deeper into that, as I’m researching for a coffee-related startup.
Wow, this article was a revelation for me. I’ve been trying to reduce my environmental footprint and the statistics on coffee production and consumption here have really opened my eyes. It’s helped me make the decision to switch to brands that emphasize fair trade and sustainable farming. Thank you, Tom, for the detailed research and presenting such eye-opening facts.
After reading about the Cold Brew Craze,I simply had to try making my own, and I’m hooked. I never realized how huge the market had become until seeing those numbers. Homemade cold brew is my new fav coffee, and I’m planning to reduce waste by reusing coffee grounds in my garden.
Those numbers on At-Home Brewsand the dominance of drip coffee makers are intriguing. As someone who’s been in the coffee industry for years, I’ve noticed a definite trend in people investing in higher-quality home coffee setups, especially since the pandemic. This trend speaks to a larger shift in consumer behavior toward valuing at-home experiences over traditional coffee shop visits.
As a barista, I find the fact that there are about 38,400 coffee shops operating in the US both inspiring and daunting. The number of specialty coffee drinkers really hammers home the importance of unique offerings to stand out in this crowded market. It’s a reminder to keep our standards high and our flavors innovative.
Needing some clarification here regarding the stats on Java by Gender.The article says men and women drink as much coffee as each other, but do we have any insights into the preferences of blends or specialty drinks between genders? This could be interesting for market segmentation.